Download the Spend Analysis Handbook
Table of Contents
Spend Analysis
Spend analysis is the process of reviewing current and historical spending. The goal of the exercise is to reduce cost, improve strategic sourcing, and increase the efficiency of spend management. An analysis requires spend data processed into KPIs and metrics and then visualized to show patterns.
An analysis is most effective when the data meets the following criteria:
- Retrieved from all sourcing, procurement, and financial transaction software databases. (including ERP, General Ledger, eProcurement, and expense management)
- Normalized so that it can be correctly associated and rolled up.
- Classified based on a hierarchical taxonomy that groups to detailed levels, preferably to the item level.
- Enriched to ensure all required fields are complete.
- Processed by an AI engine, a business rules engine, and human spend analysts who know the data set very well.
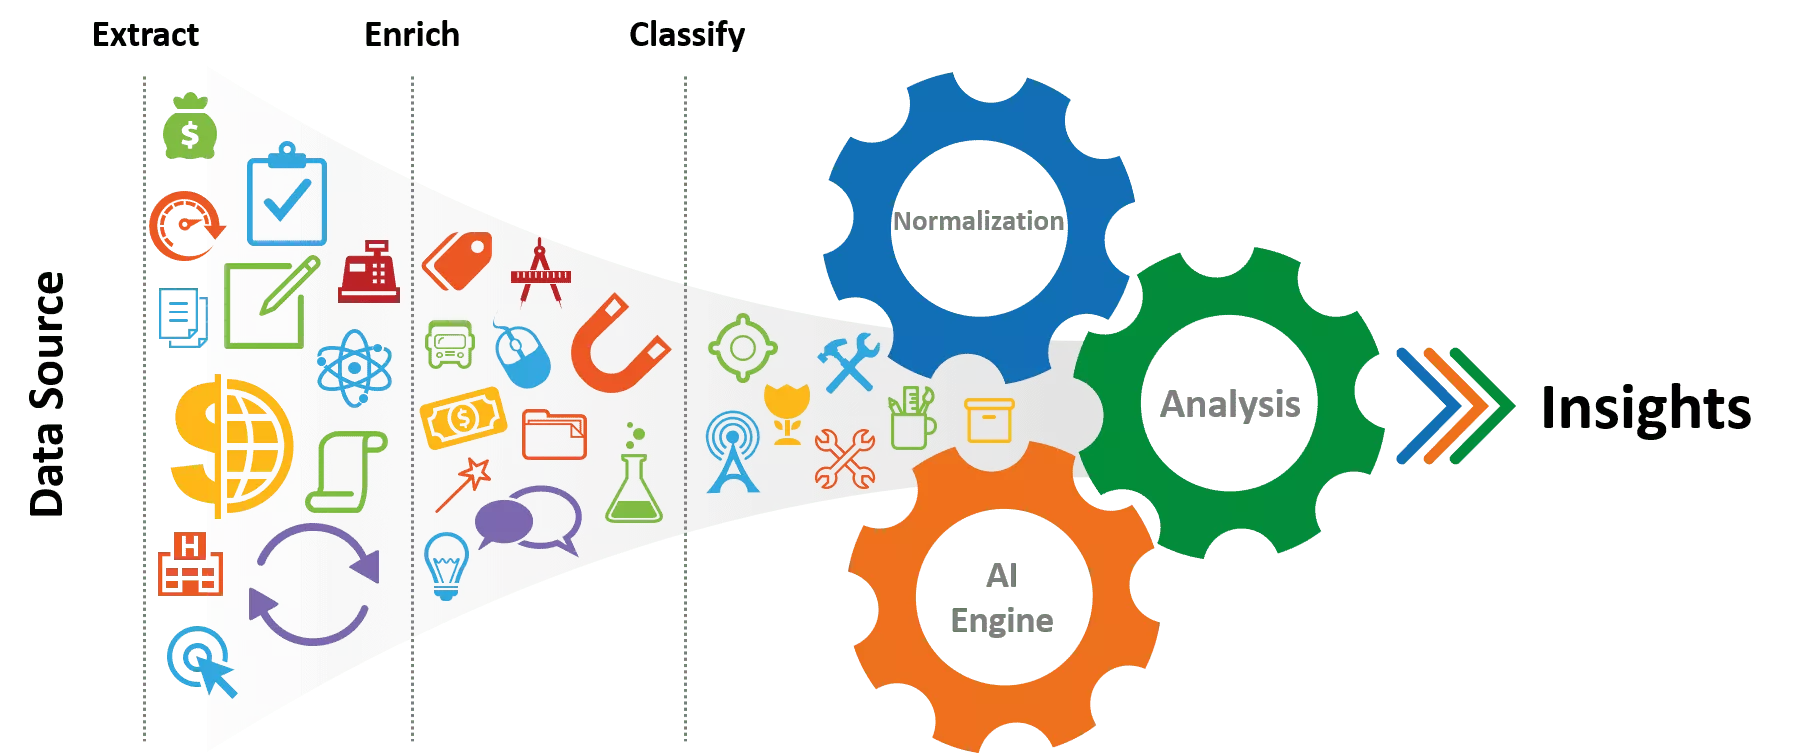
With these data conditions, there is a much higher likelihood that the analysis will be accurate and granular enough to provide actionable insights. The data processing will also be significantly faster than a human with a simple rules-engine or spreadsheet.
Traditionally, spend analysis is labor and time-intensive, taking months to complete. This length of time makes it inconvenient to do the evaluation more than once or twice a year. That forces the procurement team to work with out-of-date data and little visibility into the impact of their in-progress initiatives.
Using an AI engine to process the data, completion time can shrink to a few weeks or even a few days. When repeated many times a year, spend analytics software can track the outcome of the initiatives to compare against original goals. Procurement can make adjustments based on new inputs from up-to-date data, making spend analysis a more useful and strategic exercise.
What is Spend Analysis?
Spend analysis is the process of reviewing current and historic corporate spending with the goal of identifying cost reduction opportunities, improving strategic sourcing, and reducing procurement costs.
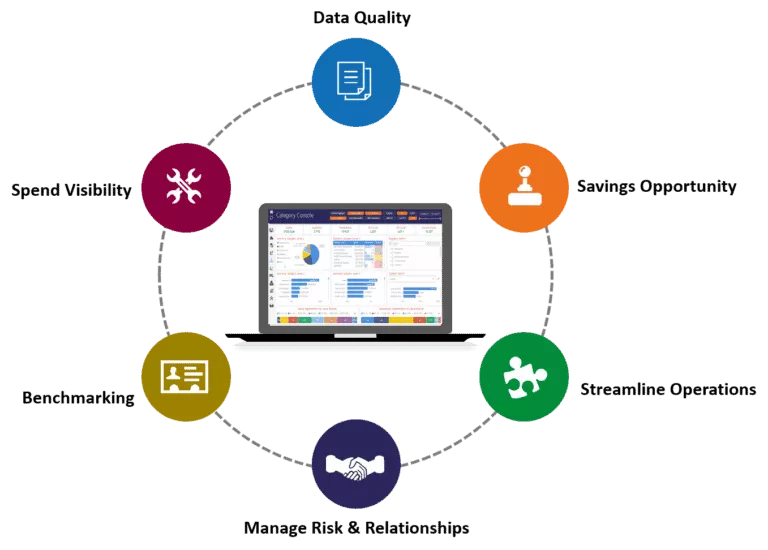
Spend analysis has three main parts:
- Spend Visibility– Having clean spend data as well as KPIs and other metrics as a way to see spending from many points of view.
- Spend Analysis– Asking questions about corporate spending and procurement, finding the answers in the metrics, and creating ways to reduce costs and improve results.
- Procurement Process Improvement– Taking the results of the analysis and implementing changes to improve future performance meeting corporate goals.
Spend Visibility
Spend Analysis depends on accurate information from all purchasing-related data sources to effectively measure sourcing variables that took place over a period of time. Key Performance Indicators (KPIs) give direct measurements regarding the past and current state of the process. Be it a simple spreadsheet chart covering the last quarter, or Spend Analysis software with several years of data, KPIs and metrics provide the visibility needed to understand the procurement data.
After all, if you can’t see it, you won’t save it.
Data Gathering and Processing for Spend Analytics KPIs and Metrics
We all know the phrase “Garbage In, Garbage Out”. This is certainly true when it comes to analyzing procurement costs. Most procurement teams follow the following process to get the granular data needed for the most accurate results.
Identify all procurement and sourcing-related data sources.
Data sources can include general ledgers, ERP systems, e-procurement software, expense systems, P-cards, etc. Collect spend data from everywhere-all departments, business units, and manufacturing plants. Remember, it’s valuable to analyze both direct and indirect spending.
Gather the data into one, main location.
Compiling data can prove difficult since the data commonly is in different formats, different currencies, or different languages. Specifically designed extract, transform, load (ETL) procedures exist to overcome these issues. A Spend Analytics solution handles the variances and ETL automatically. When using spreadsheets, procurement analysts need to process the differences themselves or use a data management tool.
Cleanse data for more accurate processing.
Besides language and currency, product and supplier fields, such as names and descriptions, are compared and normalized to be the same. For example, three different business units may buy laptops from Dell each using a different supplier name—DELL, Dell Technologies, Dell, Inc. Standardizing sourcing data makes it easier for companies (and machines and algorithms) to interpret the data.
Enrich data for complete entries and additional metrics.
Data coming from varied sources will have different fields potentially causing issues when they are brought together. Common problems include missing specific fields, abbreviations, and misspellings. Smartly combining the data generates more complete entries for each item. Include outside data sources to enrich data for more ways to analyze, for example, industry codes, supplier diversity status, and ISO certifications.
Categorize items and materials into logical hierarchies.
Having all spending data in a unifying taxonomy allows procurement professionals to understand and track where the money is being spent. There are existing categorization standards, such as UNSPSC (United Nations Standard Products and Services Code), NAICS (North American Industry Classification System), or eClass. Regardless if a company uses its own classification system or variants of existing ones, all spend must be accurately categorized including marketing, travel, office supplies, and legal services. The deeper the categorization, the more granular and informative the spend analytics can be. Classification can be a tedious, detailed, months-long task. Using Spend Analytics software with an AI-powered classification engine can speed that process to days and categorize 60-70% of the first pass data automatically. After human review and correction, the system learns and improves, classifying a higher percentage each time. The ROI on analysis solutions like these can be nearly immediate – the savings in time and resources alone are tremendous.
Spend Analysis
From purchase price variance to supplier diversity to items purchased across- business units, there are actionable insights in almost every area from the spend analysis process. The information leads to smarter, data-driven, business decisions regarding the purchases made in every part of an organization. The outcome of the analysis is a set of initiatives that will help improve purchasing efficiency, save cost, and reduce supply risk.
Procurement Process Improvements
The implementation process begins here as each initiative is assigned an owner and the activity begins. There are several common ways to make improvements, particularly in vendor management including:
- Improved item pricing and contract terms when business units buy through the same contract.
- Increase efficiency by reducing the number of suppliers for particular items or categories.
- Stronger supplier negotiation position from internal and external pricing benchmarks.
- Reduce processing time for purchase orders.
Some newer metrics are driven from internal and external compliance, like
- Level of spending on diverse suppliers—minority-, women, and veteran-owned businesses—both Tier 1 and Tier 2.
- Quality, Security, and Safety Compliance – ISO, SOX, SOC2, UL, N95
- ESG (Environmental, Social, and Governance) Initiatives
In order to measure the improvement, another analysis needs to be executed. This is not a problem when using a good spend analysis tool. Processing additional data should be fast and highly accurate based on the previous analysis. Processing the latest data provides real-time results that can show the progress made for each initiative.
The Power of a Spend Analysis
As spend analysis moves from a daunting months-long project to a task that takes a week, or a few days, the benefits to organizations increase tremendously. The following are reasons to use spend analysis and some new value gained when making it a regular procurement activity.
Improve Data Quality
The first part of a spend analysis involves gathering, cleaning, normalizing, and enriching the ALL the purchasing data. If you only use a subset of the data, you limit your review and ability to get useful results. Using data that is not scrubbed means the analysis will have duplicate items and suppliers, preventing paths for consolidation of suppliers. Remember‚ Garbage In = Garbage Out.
Increase Opportunities to Save
When you have all the data clean, you have a firm base to find trends, measure KPIs, and benchmark performance. The data needs to be classified, the deeper, the better to highlight these trends and actionable insights.
Use a Classification Taxonomy
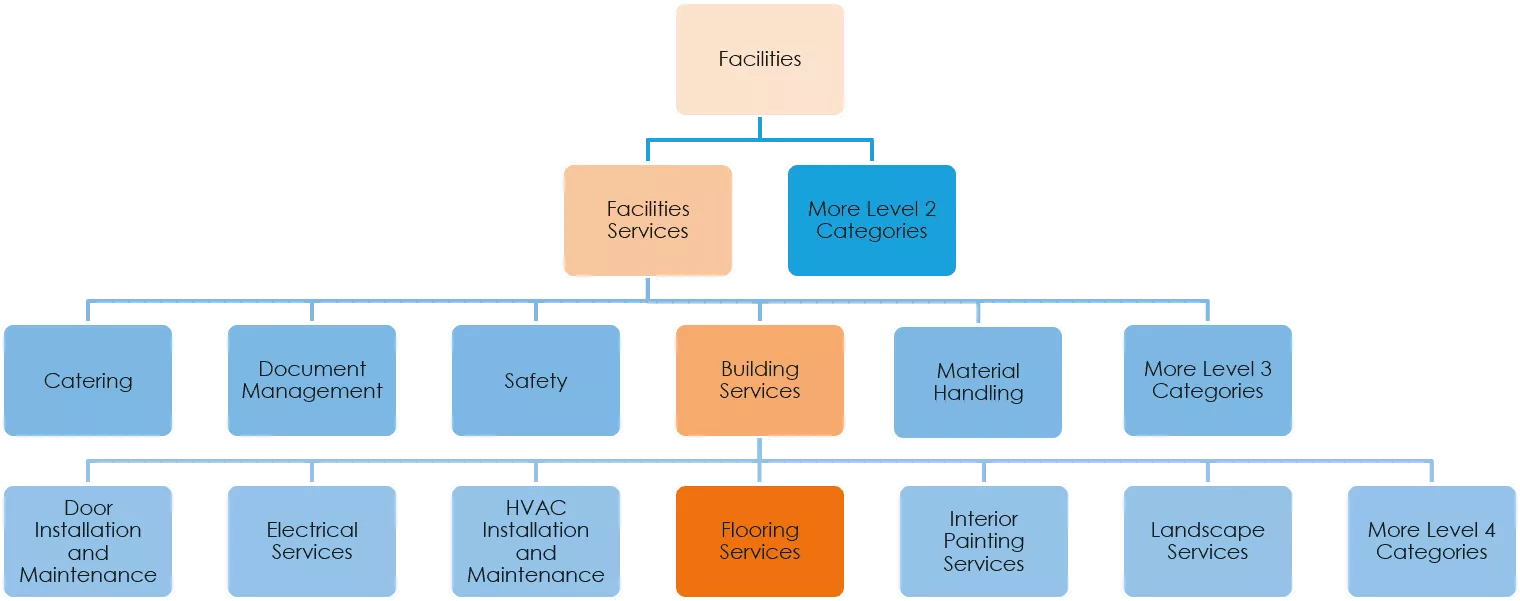
Standard taxonomies are available, including UNSPSC (United Nations Standard Products and Services Code) and eClass. Simfoni has created standard taxonomies for several industries based on working with clients for over ten years and provides them as an option to new customers. Each company must decide if the taxonomy matches its business and is complete enough to provide useful analytics.
For example, within Level 1 category Facilities, you can find Building Maintenance on Level 3 [Facility > Facility Services > Building Maintenance]. If an analysis showed that your Building Maintenance spending is significantly higher than benchmarks, it would be a target for cost reduction. With no other information, the initiative would have to dig to understand what building maintenance aspect could cause the high cost. Uncovering the source could take a long-time considering Building Maintenance has over eight very different subcategories (See diagram below).
However, if the taxonomy classifies Facilities to Level 4, the initiative could focus and be more straightforward. At Level 4, the categories are specific enough to have just a few vendors each. The analysis can guide you to the vendors or products that are more expensive than they should be. The deeper the categorization, the more granular and informative the spend analytics can be. Level 4+ categorization and granular data lead to faster problem identification and increased procurement savings.
Improve Performance with Benchmarking
Having a deep taxonomy and clean classified data means that you can easily make comparisons to evaluate procurement performance. Internal comparisons between business units or locations can help identify and address spending outliers within your organization. Procurement process KPIs can also be compared to improve efficiency, like time to have a PO signed off.
To improve even more, use third-party benchmarks to enrich your data and make comparisons to businesses in your industry or of similar size. Some software providers, such as Simfoni Spend Analytics, offer first-party data as well. Whatever kind of benchmarking you choose to do, it can help reduce material and supply costs through price reductions, as well as the cost of doing business through efficiency gains.
Managing Supplier Risks and Relationships
Supplier relationships go best when there is a human element of trust and understanding of each other. That doesn’t mean you shouldn’t arm yourself with a detailed analysis.
A procurement analysis can identify the commonality of suppliers and products across departments or business units. Combine this with the ability to see how much of this spend is under contract or not. Walk into negotiations prepared with data that can lead to volume discounts, better payment terms, and more spend under contract. The broad visibility into suppliers allows for more strategic sourcing options.
In recent years, the supply of materials and parts has been disrupted by regional and worldwide events. In 2011, a 9.0 earthquake and tsunami hit Japan, causing the Fukushima Daiichi Nuclear Power Plant disaster, which disrupted the world supply of IC chips and automotive parts from Japan. And the COVID-19 outbreak in 2020 closed all manufacturing plants in China for months. Manage the supply chain risk by evaluating where you use single-source materials or where all vendors are from the same region of the world. For example, many companies needed to spot buy personal protective equipment (PPE) from sources located outside of China when the Chinese manufacturing plants were suddenly closed.
Some of the new areas of supplier management come from internal and external governance and compliance rules. Quality, Security, and Safety standards have been in place for a long time – ISO 9001(Manufacturing Quality), ISO 13485 (Medical Devices), UL V-0 (Material Flammability), Sarbanes-Oxley (aka SOX) and SOC (Financial Data & Computer Security).
Environmental, Social, and Governance (ESG) standards have been growing in popularity. The increasing level of spending on diverse suppliers—minority-, women-, and veteran-owned businesses- is tracked because there is a public demand for change and a need for measurement and transparency. Many companies who have government contracts require tracking both Tier 1 (Direct Diverse Spending) and Tier 2 (Diverse Spending by Tier1 Suppliers) because they get credit for both, and diversity compliance in some cases. These metrics are easy to analyze when you include diversity certifications in the data enrichment process.
Spend Analytics Visualization Tools
When working on a spend analysis, it helps to visualize the KPIs and metrics generated from the data. Several software applications can show the data in charts, tables, and graphs for faster understanding.
Using Spreadsheets
Spreadsheets are ubiquitous tools–almost everyone has them and knows how to use them. Most companies provide business software with spreadsheet applications to every employee. Thus many people usually consider spreadsheets to be ‘free.’
Spreadsheets are capable of doing advanced pivot tables and cross-tabulation reports. They can also show the information in a variety of line, bar, and pie charts. Yet, there are several areas of concern when using spreadsheets for Spend Analysis.
Common Concerns When Using Spreadsheets for Spend Analytics:
- Spreadsheets are error-prone. Studies by the University of Hawaii and Dartmouth College show that errors appear in 90% of spreadsheets and 1.7% of formulas. Many well-known corporations have made billion-dollar financial mistakes due to spreadsheet errors.
- Programming costs are high. Turning the data into pivot tables and charts requires a team of super users and procurement professionals. Even with a spreadsheet superhero, programming the formulas and creating tables and graphs takes a long time. The spreadsheet software may be free, but the team’s time isn’t.
- Editability and sharing can cause security and revision issues. Spend analytics should be shared to get the most out of them. Employees copy them onto their laptops and begin making edits to see the data they want in the way they want it. The original spreadsheet could get overwritten if protections are not in place. Also, a laptop with a spreadsheet copy could get stolen, putting your confidential data at a security risk.
Using Business Intelligence (BI) Tools
Business Intelligence tools have been around for over 40 years. Still, today’s computing power and graphics engines make them significantly more powerful.
Like spreadsheets, creating BI dashboards to display the KPIs and metrics will take an experienced BI programmer. Programmers and procurement professionals will have to work together to build a variety of views needed. Business intelligence tools were designed to generate complex graphs and charts, unlike spreadsheets. These elements can be saved as templates for future use.
Large companies that already invested in BI software and skilled programmers can expand their use to sharing procurement data. Organizations that regularly use BI for their operation metrics can combine that data and the spend data to uncover even more.
Business Intelligence visualization requires accurate, granular spend data and a method to get it. When done ‘by hand,’ the data preparation process involves many people and a long time. Business rules can support the process, though they usually only cover 20% of the data.
Using a Procurement Suite
Procurement Suites have integrated applications to handle lots of different procurement areas. These areas range from contract management to PR/PO processing to reverse auctions and expense management.
These are often reasonable general procurement solutions. However, these suites were not conceived as a whole. They usually expand by building new functionality or integrating technology from acquired companies. Suites often stay strongest in their core area. The Spend Analytics module may not have the simple interface of spreadsheets, the visual power of BI solutions, or the AI and advanced algorithms of analytics specific solutions.
Using a Spend Analytics Specific Solution
Strategic Procurement professionals know their team needs accurate, granular, high-quality data to analyze. Clean, deep data yields meaningful KPIs and metrics. They allow the procurement team to find more savings, to forecast future conditions, and to improve the sourcing process. Hence, spend analytics solutions apply serious engineering efforts to produce outstanding data.
Artificial Intelligence (AI) in Procurement
All the above solutions use business rules to help sort and categorize data. Better software also uses artificial intelligence (AI) to increase the processing speed and to improve accuracy. Natural Language Processing (NLP) deals with data that involve human language. Consolidating data from different sources becomes easier when NLP can identify all the versions of a supplier’s name during normalization.
Machine Learning (ML) allows a model to ‘train’ on a data set and bring the learnings to process a new data set. These trained algorithms can process and categorize data much more rapidly. What takes humans months takes the ML algorithms only days to complete. Software as a service (SaaS) delivery models provide faster computing power and more storage allowing greater use of AI in procurement.
These SaaS solutions are using AI to expand from reports and visualization into forecasts and predictions. Spend analysis can become a frequent procurement tool thanks to the improvements in the analytics software. Eventually, it will become a continuous process rather than a discrete activity.
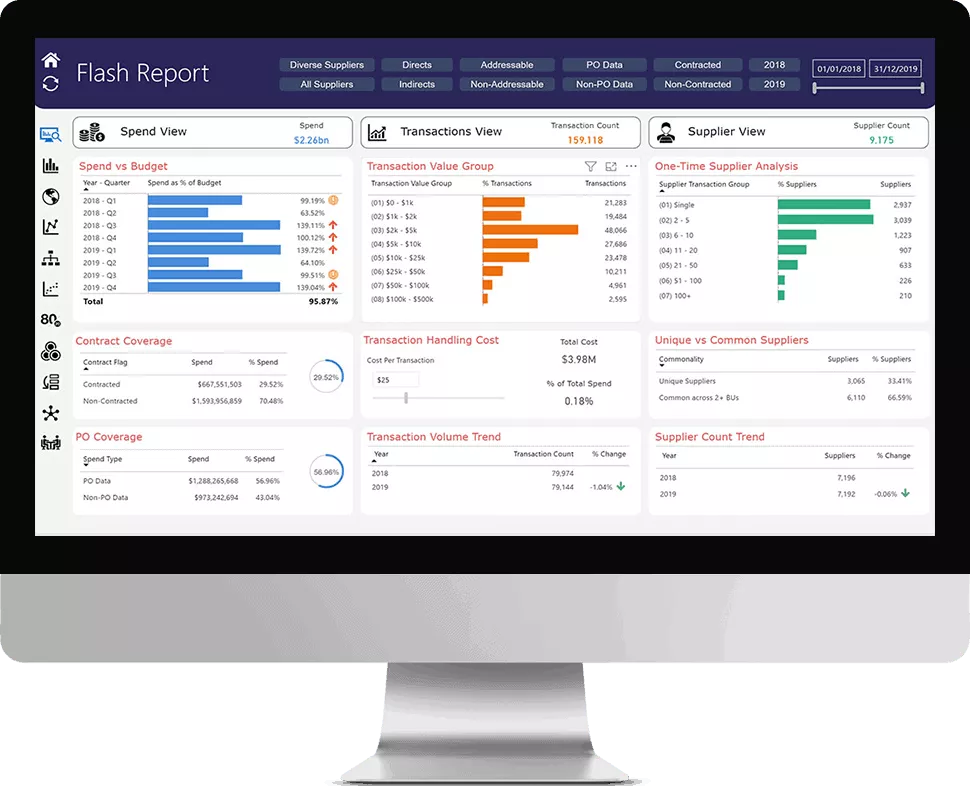
Procurement Reports and Dashboards
Displaying the analytics requires a graphing library in the code. Putting the right KPIs and metrics for a use case on the same dashboard requires procurement expertise. Most spend analytics software has a few out-of-the-box reports and dashboards. Most systems provide configuration, customization, or creation of dashboards, depending on your needs. What you can do and see right away depends on the software solution’s capabilities.
The Steps in Spend Analytics
Step 1: Analysis Scope and Data Collection
Before you look for data, you have to know what you want to find. An analytics review can be broad, all companies in a multi-national conglomerate, or narrow, direct spend for a manufacturer.
Finding data is relatively easy for smaller companies who may store the necessary data in a single ERP system. Larger companies may require access to ERPs, General Ledgers, eprocurement software, expense management solutions, and other specialized systems.
Like private equity and holding companies, companies with complex business structures may have a greater challenge due to the variety of software among their divisions, subsidiaries, and acquisitions.
Once you have set your review scope and identified the business systems that store the data, the next action is to bring the data altogether. How you do that depends on how frequently you intend to calculate the analytics.
If the analysis is a one-time or infrequent event, then exporting the data and collecting it in a spreadsheet, database, or spending analysis software is the easiest method.
If spend analytics will become a regular part of your procurement process, then using APIs and connectors to automate data extraction and loading may be worth the effort.
Step 2: Data Validation and Cleansing
Once the data has been collected together, it is validated for completeness and accuracy. Entries are consolidated, and fields are mapped to create a core data set. Data issues include missing fields, like descriptions, unreadable data, or partial data sets. The more complete the data, the better the analysis can be.
Data cleansing includes getting fields into a standard format. Entries with different formats for the same field lead to misunderstanding and big mistakes. For example, 02-05-20 can represent February 5, 2020, May 2, 2020, or May 20, 2002, depending on how you interpret numbers. Doing calculations using multiple currencies without aligning them will also lead to inaccurate results.
Step 3: Normalize Supplier Names
It’s common to call the same company by different names in different systems. It often varies based on who set the system up. After mergers or acquisitions, some companies retain their original name and become a subsidiary of another company. AI-driven analytics solutions and associate all versions of a company name to one normalized name. Normalizing supplier names is key to getting accurate assessments of total spend with any vendor. It helps identify places for establishing contracts or volume discounts.
Step 4: Item and Supplier Classification
Similar to normalization, classification tags items that are related. Using a taxonomy with a deep hierarchy for category management aids the data breakdown. KPIs and metrics for individual categories allow comparisons that drive savings insights. Both items and suppliers are classified to allow a narrow focus in the data.
Step 5: Data Enrichment
Data sets can be enriched by processing to create the KPIs and metrics that drive basic analysis – totals and averages, by supplier or category, trends, or year-over-year comparisons. These are all based on your data set.
Data can be enriched with external information, as well. Common added information includes certified diverse suppliers, procurement process benchmarks, and commodity pricing. The additional data can drive comparisons to industry standards or leaders and provide new targets to achieve.
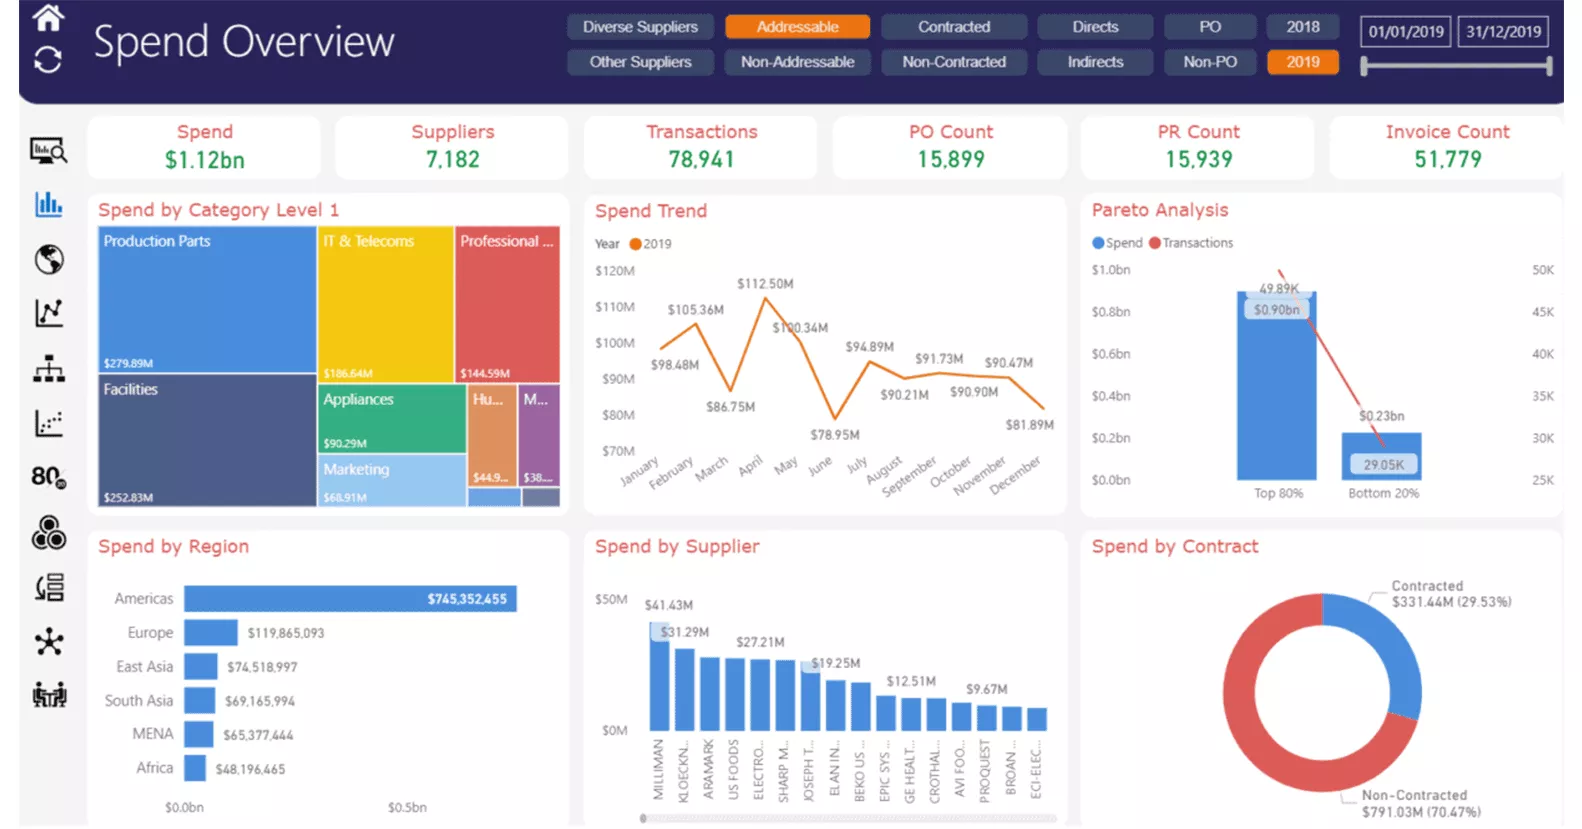
Step 6: Visualization and Spend Analysis
The enriched data can be accessed in many ways but visualized in themed dashboards allows people to review areas of interest systematically. Procurement analysts know what to look for and, for example, go right to a commonality report if they want to consolidate purchases across fewer vendors.
These dynamic reports have filters that allow users, like category managers, to focus only on their interest area. Clicking around the reports can yield great savings ideas, but it can also be time-intensive.
Simfoni Spend Analytics provides automated opportunity analysis. The system reviews the common ways to save, identifies areas to save or improve, and grades it for estimated savings and difficulty to complete.
Analysts can accept the result or have the opportunity analysis focus on a particularly important area or a new KPI. The report shows the initiatives and the savings, and the order in which to do them!
Step 7: SAVE – Kick-off and Execute Procurement Initiatives
With your wave plan in hand, there is nothing left but assigning teams and kicking-off the initiatives. This may sound like many steps, but most of these can be done by software instead of humans if you pick the right Spend Analytics system.
Request a Demo on Spend Analysis
Book a Demo on Spend Analysis today to know more about how Simfoni’s technology and processes can help your organization achieve, AI in Procurement, world-class Spend Analytics and Spend Automation.
Frequently Asked Question (FAQ)
For your help, we have created a list of answers to assist you more.
What is spend analysis?
Spend analysis is defined as the process of systematically reviewing both current and historical spending within an organization. This process involves several key components:
Data Collection: Gathering expenditure data from various sources across the organization.
Data Cleaning: Ensuring the accuracy and reliability of the collected data by eliminating errors and inconsistencies.
Data Classification: Categorizing and classifying spending data into different groups and categories.
Data Analysis: Using analytical tools and techniques to analyze the categorized spending data.
The primary objectives of spend analysis include:
Cost Reduction: Identifying opportunities to reduce costs and optimize spending.
Efficiency Improvement: Streamlining procurement processes and enhancing efficiency.
Strategic Sourcing: Supporting strategic sourcing efforts by providing insights into spending patterns.
Supplier Relationship Enhancement: Strengthening relationships with suppliers by making informed decisions based on spending data.
Spend analysis helps organizations extract maximum value from their procurement expenditures by providing visibility into how money is spent and where improvements can be made. It answers crucial financial questions, such as what the organization is spending money on, who the money is being spent with, whether value for money is being achieved, and if there are better procurement options available.
In essence, spend analysis is a data-driven approach that aids organizations in making informed decisions, optimizing their procurement processes, and ultimately achieving cost savings and efficiency improvements.
What are the 4 stages in spend analysis?
Spend analysis typically consists of four key stages:
- Data Collection: The first stage involves gathering data from various sources within an organization. This data can include invoices, purchase orders, contracts, and supplier information. The goal is to compile a comprehensive dataset that covers all aspects of spending.
- Data Cleansing: Once the data is collected, it needs to be cleaned and standardized. This stage involves removing duplicates, correcting errors, and ensuring consistency in data format. Clean data is essential for accurate analysis.
- Data Classification: In this stage, the spending data is categorized into different groups or categories. This classification helps identify where and how money is being spent. Common categorizations include direct and indirect spending, categories like raw materials, services, and capital expenditures, and supplier segmentation.
- Data Analysis: The final stage involves analyzing the categorized spending data to gain insights and make informed decisions. This analysis can include identifying cost-saving opportunities, negotiating better contracts with suppliers, optimizing procurement processes, and ensuring compliance with policies.
What is an example of spend analysis?
An example of spend analysis could involve a manufacturing company looking to optimize its procurement process. The company collects data on all its purchases over the past year, categorizes spending into different areas (e.g., raw materials, maintenance services, office supplies), and analyzes the data.
During the analysis, the company might discover that it is overspending on certain raw materials due to unfavorable supplier contracts. This insight prompts them to renegotiate contracts, leading to significant cost savings. Additionally, they might identify inefficiencies in their office supplies procurement, enabling them to streamline the process and reduce unnecessary expenditures.
What is the formula for spend analysis?
There isn’t a single formula for spend analysis, as it involves various calculations and metrics depending on the specific goals and objectives of the analysis. However, some common formulas and metrics used in spend analysis include:
- Spend Analysis Ratio: Total spend on a category or supplier / Total spend
- Price Variance: (Current Price – Previous Price) / Previous Price
- Savings Calculation: Previous Spend – Current Spend
- Supplier Performance: Supplier Quality + On-Time Delivery + Cost Competitiveness
- Sourcing Savings: (Current Supplier Cost – New Supplier Cost) / Current Supplier Cost
The choice of formula depends on what insights you want to gain from your spend analysis and the data available.
What is a spend analysis tool?
A spend analysis tool is software designed to automate and facilitate the process of collecting, cleansing, categorizing, and analyzing spending data within an organization. These tools are essential for organizations with large volumes of data as they provide efficient and accurate ways to gain insights into spending patterns.
Spend analysis tools often offer features such as data visualization, reporting, supplier performance tracking, and trend analysis. They can help organizations identify cost-saving opportunities, optimize procurement strategies, and ensure compliance with procurement policies.
What are the types of spend analysis?
There are several types of spend analysis, including:
- Strategic Spend Analysis: Focuses on identifying long-term cost-saving opportunities and improving overall procurement strategies.
- Operational Spend Analysis: Concentrates on day-to-day spending to enhance efficiency and compliance with procurement policies.
- Supplier Spend Analysis: Analyzes spending patterns with specific suppliers to evaluate their performance and negotiate better terms.
- Category Spend Analysis: Examines spending within specific product or service categories to identify cost-saving opportunities and supplier consolidation possibilities.
- Contract Compliance Analysis: Ensures that spending aligns with the terms and conditions of supplier contracts.
The type of spend analysis chosen depends on an organization’s goals and the areas it wants to improve.
Why do we do spend analysis?
Spend analysis is crucial for several reasons:
- Cost Reduction: It helps identify cost-saving opportunities, such as negotiating better contracts with suppliers and eliminating unnecessary expenditures.
- Risk Mitigation: By analyzing spending patterns, organizations can identify potential risks and take preventive measures, such as diversifying their supplier base.
- Supplier Performance: Spend analysis allows organizations to evaluate supplier performance and make informed decisions about supplier relationships.
- Compliance: It helps ensure that spending aligns with procurement policies and regulations, reducing the risk of non-compliance.
- Strategic Insights: It provides valuable insights for long-term strategic planning and decision-making.
What is ABC analysis in spend analysis?
ABC analysis, in the context of spend analysis, is a method of categorizing items or suppliers based on their importance to an organization. It helps prioritize items or suppliers for more focused analysis and management. The categories in ABC analysis typically include:
- A Category: High-value items or suppliers that represent a significant portion of spending and require close monitoring and management.
- B Category: Items or suppliers of moderate importance that require regular attention but not as much as A-category items or suppliers.
- C Category: Low-value items or suppliers that make up the majority of transactions but have relatively low impact on spending.
ABC analysis enables organizations to allocate resources effectively, concentrate efforts on areas with the most significant impact, and optimize their procurement strategies accordingly.
What are the best practices for data collection in spend analysis?
Efficient data collection is fundamental to ensuring the precision of spend analysis. Here are some recommended approaches:
Diverse Data Sources: Aggregate data from a range of origins, encompassing invoices, purchase orders, contracts, and supplier databases, to establish a comprehensive dataset.
Uniform Data Standards: Standardize data formats, codes, and units of measurement to maintain uniformity and precision.
Regular Data Validation: Continually validate data to pinpoint and rectify any errors or inconsistencies promptly.
Holistic Data Integration: Combine data from disparate departments or systems to construct a comprehensive overview of spending.
Timely Data Collection: Gather data at regular intervals to guarantee it accurately represents prevailing spending patterns.
How can organizations improve supplier performance through spend analysis?
Improving supplier performance through spend analysis involves:
- Supplier Evaluation: Use spend analysis data to assess supplier performance in terms of quality, delivery, and cost competitiveness.
- Supplier Collaboration: Collaborate with key suppliers to identify areas for improvement and negotiate mutually beneficial agreements.
- Supplier Development: Invest in supplier development programs to enhance their capabilities and performance.
- Diversification: Identify and mitigate risks by diversifying the supplier base.
- Contract Management: Ensure that supplier contracts are clear, enforceable, and aligned with organizational goals.
What role does technology play in spend analysis?
Technology, including spend analysis tools and data analytics software, plays a significant role in automating and enhancing the spend analysis process. It helps by:
- Efficiency: Automating data collection, cleansing, and categorization processes, saving time and reducing errors.
- Data Visualization: Providing visual representations of spending data for better insights and decision-making.
- Real-time Analysis: Enabling organizations to analyze spending patterns in real time for proactive decision-making.
- Predictive Analytics: Using historical data to predict future spending trends and identify opportunities for cost savings.
- Compliance Monitoring: Automating compliance checks to ensure adherence to procurement policies and regulations.
What are the common challenges in spend analysis?
Some common challenges in spend analysis include:
- Data Quality: Ensuring data accuracy, completeness, and consistency.
- Data Integration: Integrating data from various sources and systems.
- Data Volume: Handling and analyzing large volumes of data.
- Talent and Skills: Having skilled analysts who can interpret data effectively.
- Technology Adoption: Implementing and maintaining the right spend analysis tools.
- Change Management: Overcoming resistance to changes in procurement processes.
How often should organizations perform spend analysis?
The frequency of spend analysis varies according to the organization’s objectives and the characteristics of its expenditures. Typically, organizations conduct annual spend analyses as an integral component of their strategic planning. However, some organizations opt for more frequent assessments, like quarterly or semi-annual reviews, to continuously track expenditure trends and adapt as necessary.
What are the benefits of category spend analysis?
Category spend analysis offers several benefits, including:
- Cost Reduction: Identifying cost-saving opportunities within specific spending categories.
- Supplier Consolidation: Evaluating the potential for consolidating suppliers within a category.
- Risk Management: Assessing risks associated with specific categories and taking appropriate measures.
- Strategic Sourcing: Informing strategic sourcing decisions within categories.
- Performance Tracking: Monitoring supplier performance within each category.
How can organizations ensure compliance through spend analysis?
To ensure compliance through spend analysis, organizations can:
- Define Procurement Policies: Establish clear procurement policies and guidelines.
- Automate Compliance Checks: Implement automated checks to ensure spending aligns with policies.
- Regular Audits: Conduct regular audits to identify and rectify non-compliance issues.
- Supplier Collaboration: Collaborate with suppliers to ensure contract adherence and compliance.
- Training and Education: Provide training and education to procurement teams on compliance requirements.
What are the key success factors for a spend analysis initiative?
Key success factors for a spend analysis initiative include:
- Executive Support: Secure support and buy-in from top management.
- Data Quality: Ensure high-quality, clean, and reliable data.
- Skilled Personnel: Have a team of skilled analysts and data experts.
- Clear Objectives: Define clear objectives and goals for the analysis.
- Technology: Invest in the right technology and tools.
- Continuous Improvement: Continuously review and improve analysis processes.
- Actionable Insights: Translate analysis results into actionable strategies and decisions.
Useful Resources
- Cost Reduction Strategies in Procurement.
- Effective Procure-to-Pay Process Guide (P2P Procurement).
- Guide to eProcurement software & Solutions.
- Guide to Manage Tail Spend and Improve the Bottom Line.
- Guide to Procurement Software & eProcurement Solution.
- Guide to Understanding Category Management in Procurement.
- Leveraging AI & Machine Learning in Procurement.
- Procurement Analytics & Implementation.
- Procurement Management - Key Steps and Roles.
- Procurement Marketplace - Reinventing Procurement
- Savings Tracking Process in Procurement.
- Source to Pay Process, Steps & Definition.
- Spend Analysis in Procurement: Importance, Process & Examples.
- Supplier Diversity in Procurement
- Sustainable Procurement - Importance & Best Practices
- Understanding the What, Why, & How of Strategic Sourcing.
- Procurement Auctions – How It Works, Example, and Risks.
- Supply Chain Management (SCM): How It Works and Why It Is Important
- What is Contract Management - Everything You Need to Know
- B2B Marketplace - The Ultimate Guide to Procurement Marketplace
- Spend Management - Importance & Best Practices On Business Spend Management Software & Solutions
- Strategic Sourcing – Ultimate Guide To Strategic Sourcing Processes
- Spend Cube – Ultimate Guide to Spend Cube Analysis
- Procurement Software - Automate Your Procurement Process
