Most procurement teams have a clear view of their top 50 suppliers. They know the contract terms, the renewal dates, the negotiated rates. But ask about the other 80% of the supplier base, the hundreds or thousands of vendors that collectively account for 10 to 20% of total spend, and the picture gets blurry fast.
That blurry picture is your tail spend. And until you run a proper tail spend analysis, you’re making decisions about it based on assumptions rather than data.
The good news: the data you need already exists in your AP and P-card systems. The challenge is pulling it together, cleaning it up, and reading it in a way that leads to action.
What a Tail Spend Analysis Actually Measures
A tail spend analysis goes well beyond a Pareto chart. It is a structured look at the fragmented, low-value, high-volume purchases that fall outside your managed sourcing programs. The goal is to understand four dimensions of that fragmentation.
Supplier count against spend share. How many vendors make up the bottom 20% of your spend? In most organizations, the answer is surprisingly large. Hundreds of suppliers, each receiving a handful of invoices per year, each requiring onboarding, payment processing, and compliance checks.
Transaction volume. Tail spend tends to generate a disproportionate number of transactions relative to its dollar value. A $50,000 annual spend spread across 200 invoices creates far more operational cost than a $500,000 contract paid in quarterly installments.
Category fragmentation. Tail purchases span dozens or hundreds of categories, from office supplies and maintenance parts to one-off professional services. Without classification, you cannot see which categories have consolidation potential and which are genuinely one-time needs.
Off-contract purchasing. Some tail spend is maverick spend in disguise. Employees buying from non-preferred vendors when a contracted supplier exists. Identifying this overlap is one of the highest-value outcomes of the analysis.
How to Run a Tail Spend Analysis
You do not need a six-month project to get started. But you do need to follow a disciplined sequence.
Pull the right data. Start with 12 to 24 months of AP transaction data. Include P-card transactions, which are often where the most fragmented tail spend hides. If you have ERP exports, pull those too. The wider the data set, the more accurate your picture.
Normalize supplier names. This is the step most teams underestimate. The same vendor might appear as “ABC Corp,” “ABC Corporation,” “ABC Corp Inc,” and “A.B.C. Corp” across different systems. Without normalization, your supplier count is inflated and your consolidation opportunities are invisible. AI-driven classification can process thousands of records per minute, turning weeks of manual work into hours.
Classify spend into categories. Every transaction needs a category. Unclassified spend is invisible spend. Classification should follow a standard taxonomy so you can benchmark and compare across business units or geographies.
Set the tail threshold. There is no universal rule. Some organizations define tail spend as everything below $50,000 per supplier per year. Others use the Pareto principle and draw the line where 80% of suppliers account for 20% of spend. The right threshold depends on your organization’s size, complexity, and category structure. Pick one, document it, and apply it consistently.
Reading the Results
Once you have clean, classified, normalized data, you can segment your spend into three actionable buckets.
Strategic sourcing candidates. Some tail spend turns out to be concentrated enough to justify a formal sourcing event. If you discover $300,000 spread across eight suppliers in a single category, that is not really tail spend. That is an unsourced category waiting for a competitive bid.
Preferred vendor consolidation. Other tail spend involves categories where you already have a contracted supplier, but employees are buying from alternatives. Redirecting this spend to preferred vendors improves compliance, strengthens negotiating leverage, and reduces supplier management overhead.
True fragmented tail. The remainder is the genuine tail: low-value, infrequent, spread across many vendors and categories, and not worth a formal sourcing event. This is the spend that creates the most AP burden relative to its value. It is also the spend that requires a different management approach entirely.
The Analysis Layer
Running this kind of analysis manually, in spreadsheets, with VLOOKUP formulas and pivot tables, is possible but painful. And it is a snapshot. The moment you finish, the data starts aging.
Spend Analytics includes dedicated views built for exactly this work. The Tail Spend Analysis view surfaces supplier count, transaction volume, and category fragmentation in a single dashboard. Supplier Consolidation analysis identifies where multiple vendors serve the same category. P-Card Analysis captures the fragmented purchases that never touch your purchase order system. And because the platform is Snowflake-native with AI-driven classification, the data stays current rather than decaying in a static report.
This is where the analysis becomes a living capability rather than a one-time exercise.
The Action Layer
Analysis without action is just overhead. Once you know what your tail spend looks like, the question becomes: what do you do with each segment?
Strategic sourcing candidates go into your sourcing pipeline. Preferred vendor consolidation becomes a compliance initiative. The true fragmented tail, the hundreds of small vendors and one-off purchases, needs a different solution.
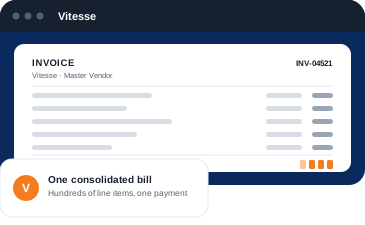
This is the problem Vitesse was built to solve. It is a managed master-vendor service for tail spend. Employees route small purchases through Vitesse, which vets the vendor and purchase before payment, handles onboarding (most suppliers are active within 1 to 3 business days), and consolidates everything into one invoice. Every routed purchase is auto-classified across 200+ procurement categories, giving you real-time visibility into what was bought, from whom, and whether a preferred vendor already exists.
The operational impact is meaningful. Organizations using Vitesse see an average 70% reduction in invoice processing workload and 30% fewer small vendors on their tail spend. That is tail spend management that starts with data and ends with measurable results.
Where to Start
If you have not run a tail spend analysis recently, or ever, start small. Pull 12 months of AP data for a single business unit. Normalize, classify, and segment. The patterns you find will almost certainly justify expanding the effort.
The companies that manage tail spend well know which spend deserves strategic attention, which spend belongs with preferred vendors, and which spend needs to be routed through a simpler, consolidated process. A disciplined tail spend analysis gives you that clarity.