Spend Analytics Dashboard is an interactive dashboard that provides knowledge into an organization’s procurement activities and expenditures. It allows the organization to identify areas for cost reduction and process improvement. Additionally Spend Analytics Dashboard helps in the process of analyzing expenditure data with the purpose of decreasing procurement costs, improving efficiency, and monitoring controls and compliance.
So, here we are going to describe some of the features that make Spend Analytics Dashboard the best among all:
How Does Spend Analytics Dashboard Facilitate Data Management?
Spend Analytics Dashboard facilitates data management by offering functionality to easily manage all your data directly from the dashboard. It helps identify and correct wrong entries, preventing data fluctuations that could impact important decisions, ensuring data is perfect for further use.
You may have noticed that some of the time people enter the wrong data into the system that affects the whole functionality in a negative way. The existing data of the system starts to fluctuate due to which there occurs a huge difficulty to take some important decisions. While Spend Analytics Dashboard helps you in this regard. You can easily find out the wrong entries from the data directly from the dashboard and then make it perfect for further use.
How Does Spend Analytics Dashboard Optimize Performance?
With the help of the Spend Analytics Dashboard, you can easily optimize the performance of the system. Without getting into the depth of the application, you can perform all the basic tasks such as prioritizing profitable customers or reducing lower inventory directly from the dashboard by which the overall performance of the system can be optimized. Additionally, you can get the reports of each module of the application from the Spend Analytics Dashboard which also becomes the cause of performance optimization.
Read More:- Guide to Sourcing
What Advanced Filters and Searches Does Spend Analytics Dashboard Offer?
In an application, there are lots of modules are working simultaneously that are usually correlated to each other. all of these modules inter-linked with each other in a way that if you require any specific report that offers the overall working of system, then you have to switch to number of modules in the meantime, or maybe you have to do all of this manually by yourself.
While Spend Analytics Dashboard facilitates you a lot in this regard. It offers advanced filters and searches regarding all of the modules used in the application. So, if you require any kind of data according to your search requirements, then you will easily get it from the Spend Analytics Dashboard.
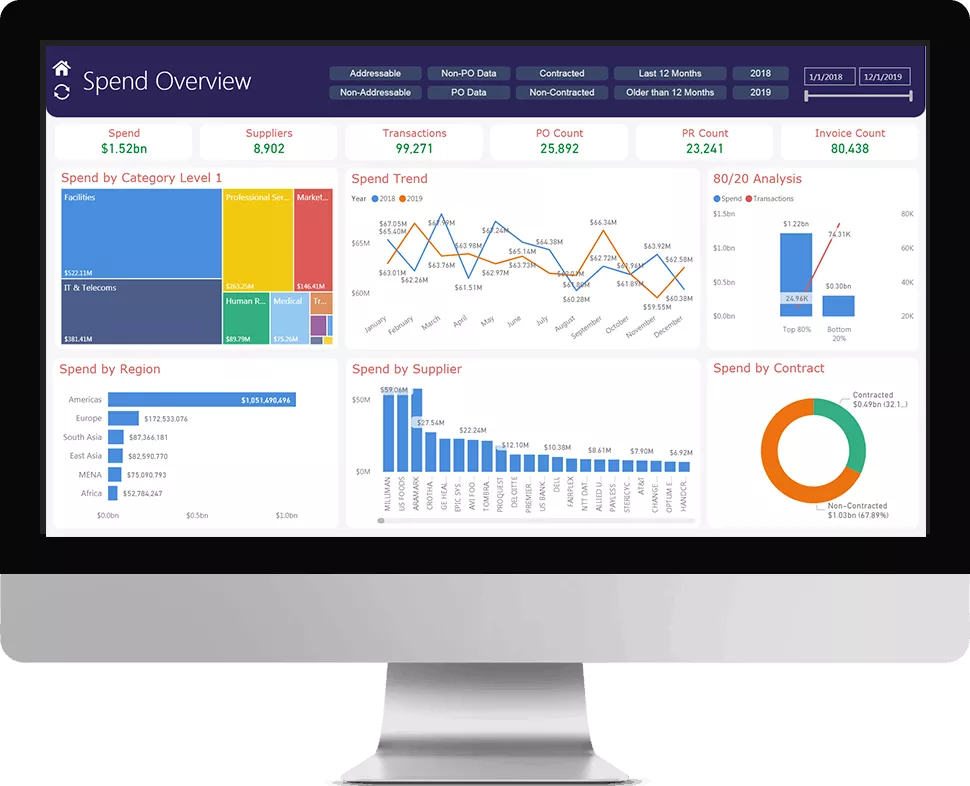
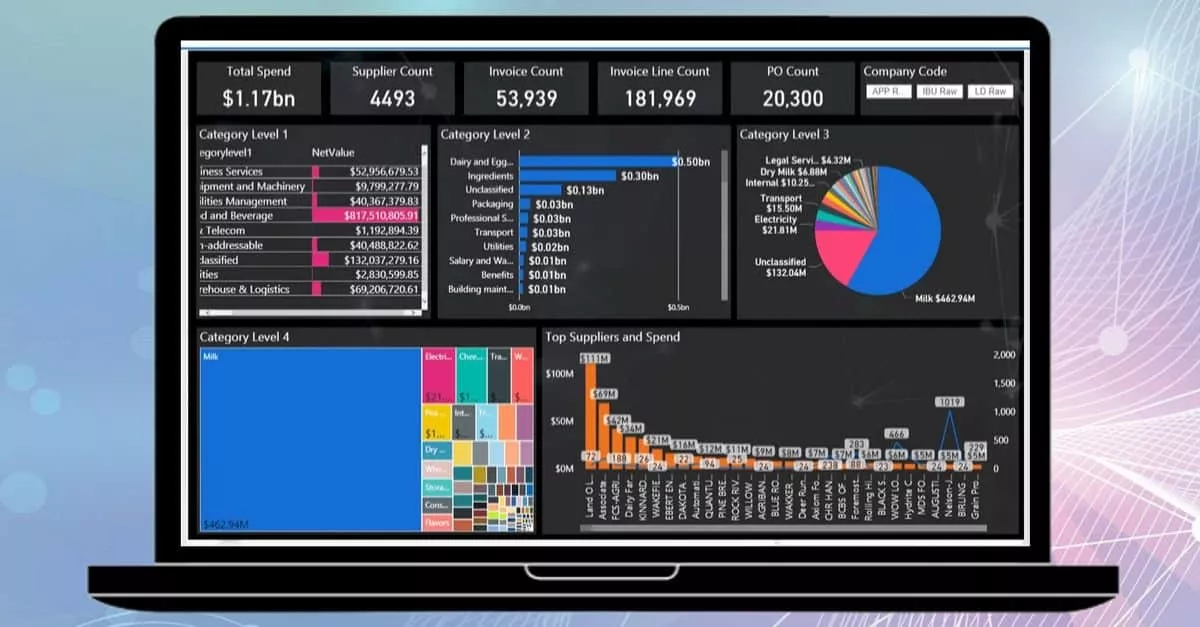
How Interactive is the Spend Analytics Dashboard's Visualization?
Spend Analytics Dashboard offers the most interactive visualization as compared to other dashboard styles and formats. It offers particular charts, graphs, and tables as the report of each module used in the application. Also, the color schemes and multi-touch interactivity offer it a great edge over other dashboard formats.
Well, the above has described some of the key features of the Spend Analytics Dashboard. Consider all of these features and make sure to use Spend Analytics Dashboard for your web or desktop application.
Contact us today to know more about how Simfoni’s technology and processes can help your organization achieve world-class Spend Analytics , Savings Tracking & Tail Spend Management Solutions.